Impact
Mapping
Role of data and stories
Buchanan, Liberia
pop: 35,000
2 yrs

Direct Impact: +1500
Income: +350%
Savings grps: 97%
Paid it Forward:
Safe water for 200 hshlds
Clinic serving 1,500/mo
Bicol, Philippines
Rural by Lagazi City
12 mo

Households: 152
Impacting: +800
Income w/ busi: +27%
New savings+14%
Resident led projects
Sharing food. Mutuality grows
Rwanwanja, Uganda
Refugees: 75,000
6 mo

Households: 100
Impacting: +700
Income increase: 21%
Families “more independent”
Mutuality is growing
Rwamwanja, Uganda
Refugee Youth 16 – 24 yrs
6 mo

Youth enrolled:100
Idle youth started businesses
Income increased:99%
Started group savings
Started collective businesses
Jalisco, Mexico
12 mo

Households: 147
Impacting: +500
Business income: +44%
Helped with funeral expenses
Santa Marta, Colombia
12 mo

Households:102
Impacting:+500
Business income :+43%
Built steps for child safety
Women formed support grps
Kisoro, Uganda
Farming area
10 mo

Households:100
Impacting: +700
Business income:22%
Tracking 224 businesses
Long waiting list to join
Child Center, NY
Starting in 2022

Households planned:300
Impacting: 1,000
Enrolling from 3 sites including
ex-offenders, etc.
Asossa, Ethiopia
Starting in 2022

Refugees from Sudan
Internally displaced
Host families
Target :+1,000
Bunagana, DR Congo
Starting in 2022

Households: 100
Impacting :+500
Conflict in Congo delays start
Mwanza, Tanzania
Starting in 2022

Self-organized group
Led by a local teacher
Kisumu, Kenya
Starting in 2022

Self-organized group
Led by a local teacher
Oakland, California
Starting late 2022

Small minority owned business
Creating jobs for the community
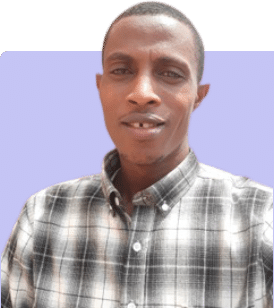
Wilson Rwamugabo
AVSI liaison
“…the participants (in other programs) become over-dependent on program staff – makes sustainability a challenge – especially at the close of projects. With CII, however… the families/groups have been supporting themselves.” “When you see them in a meetings today, they interact as very close friends and peers.”
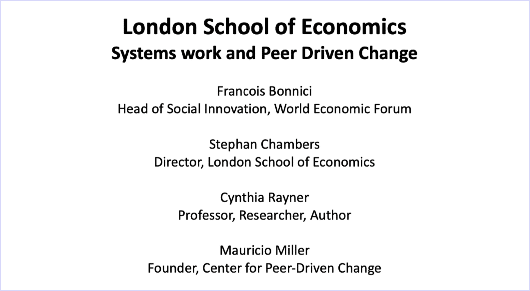
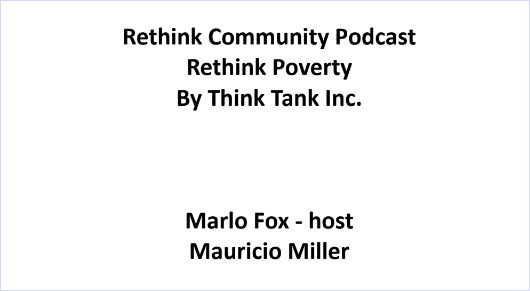

Podcasts, Presentations on PDC
Panel discussion on PDC and systems change London School of Economics
Think Tank interview with Marlo Fox on PDC
Presentation to Catalyst 2030 workgroup on PDC
Awakin presentation with David Bonbright
